Maintenance
Keep your equipment running: track every machine, take problem reports from the floor, plan work before things break, and see what it all costs.
Last updated on August 15, 2026
Maintenance is where your organization looks after its equipment. It holds a record of every machine, tool and facility you maintain, takes problem reports from the people who use them, turns those reports into jobs, and schedules the routine servicing that stops problems happening in the first place. Everything a technician does on a job (the steps they follow, the time they book, the parts they take) is recorded on that job, so later you can answer the questions that matter: which machine costs us the most, how long we take to fix things, and whether our preventive work is actually being done.
You reach the module from the left sidebar under Maintain, then Maintenance.
Before you start
Nothing is required to start reporting problems. To get the most out of the module, it helps to have:
- Your assets set up: the machines, tools and facilities you look after. You add these yourself, and one asset can sit inside another (a spindle inside a mill, a mill inside a line).
- Failure codes (the Problem, Cause and Remedy lists) so breakdowns can be classified. A starter set is created with the module and an administrator can edit it.
- Optional but useful: procedures, the step-by-step checklists a technician follows, and PM plans, the schedules that raise routine work automatically.
Find the machine you care about
Everything in Maintenance hangs off an asset, so this is where you usually start.
- Open Maintenance from the sidebar. The Assets page lists everything you maintain, with its Asset #, Name, Category, Status, Operational state, Criticality and the production machine it is linked to.
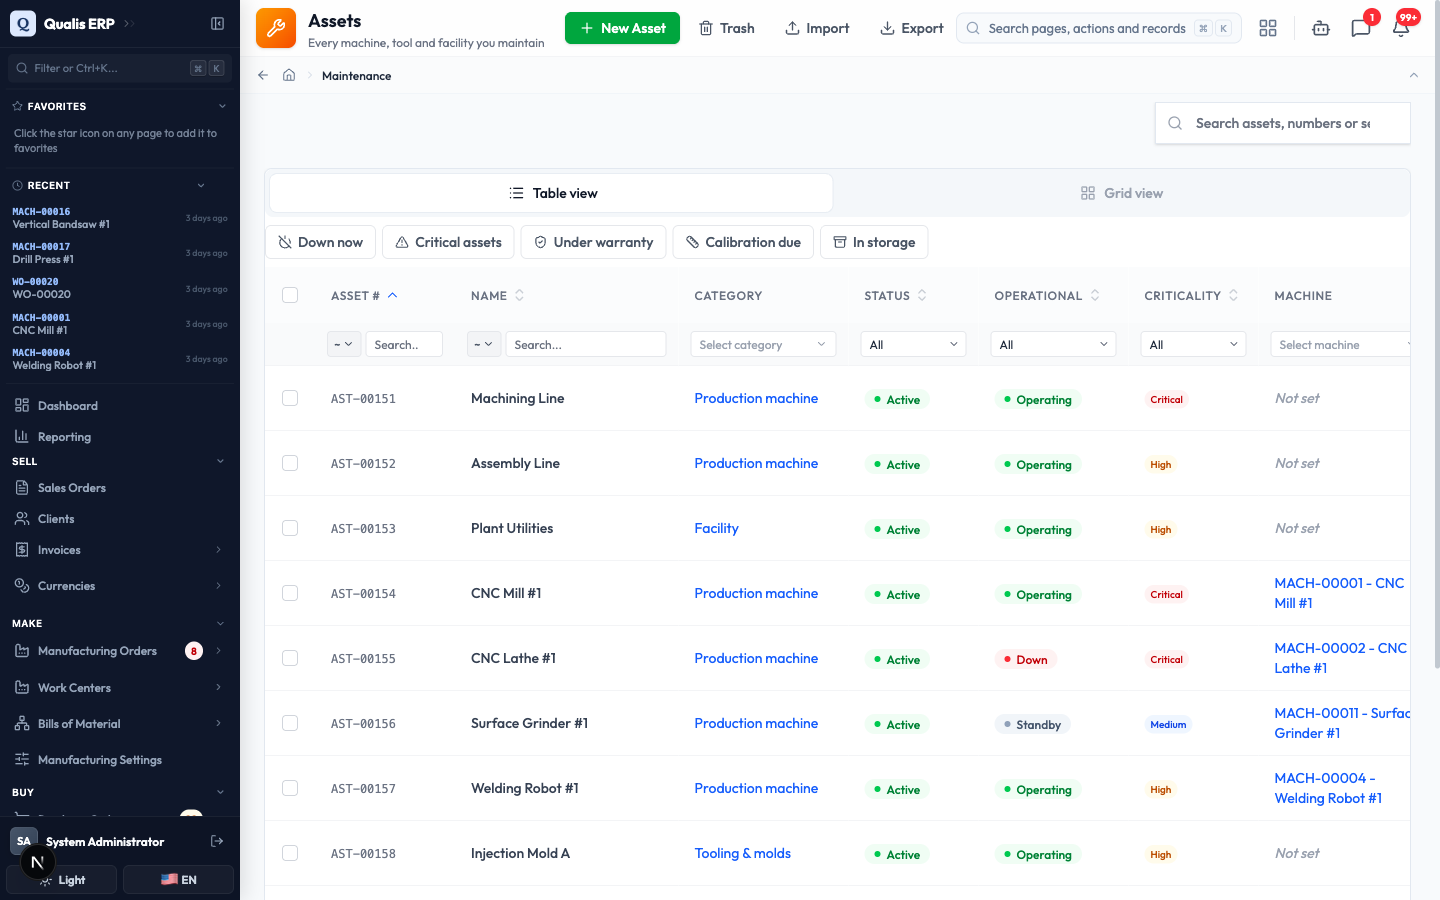
- To narrow the list, type in the Search assets, numbers or serials box, or use a quick filter above the table: Down now, Critical assets, Under warranty, Calibration due or In storage.
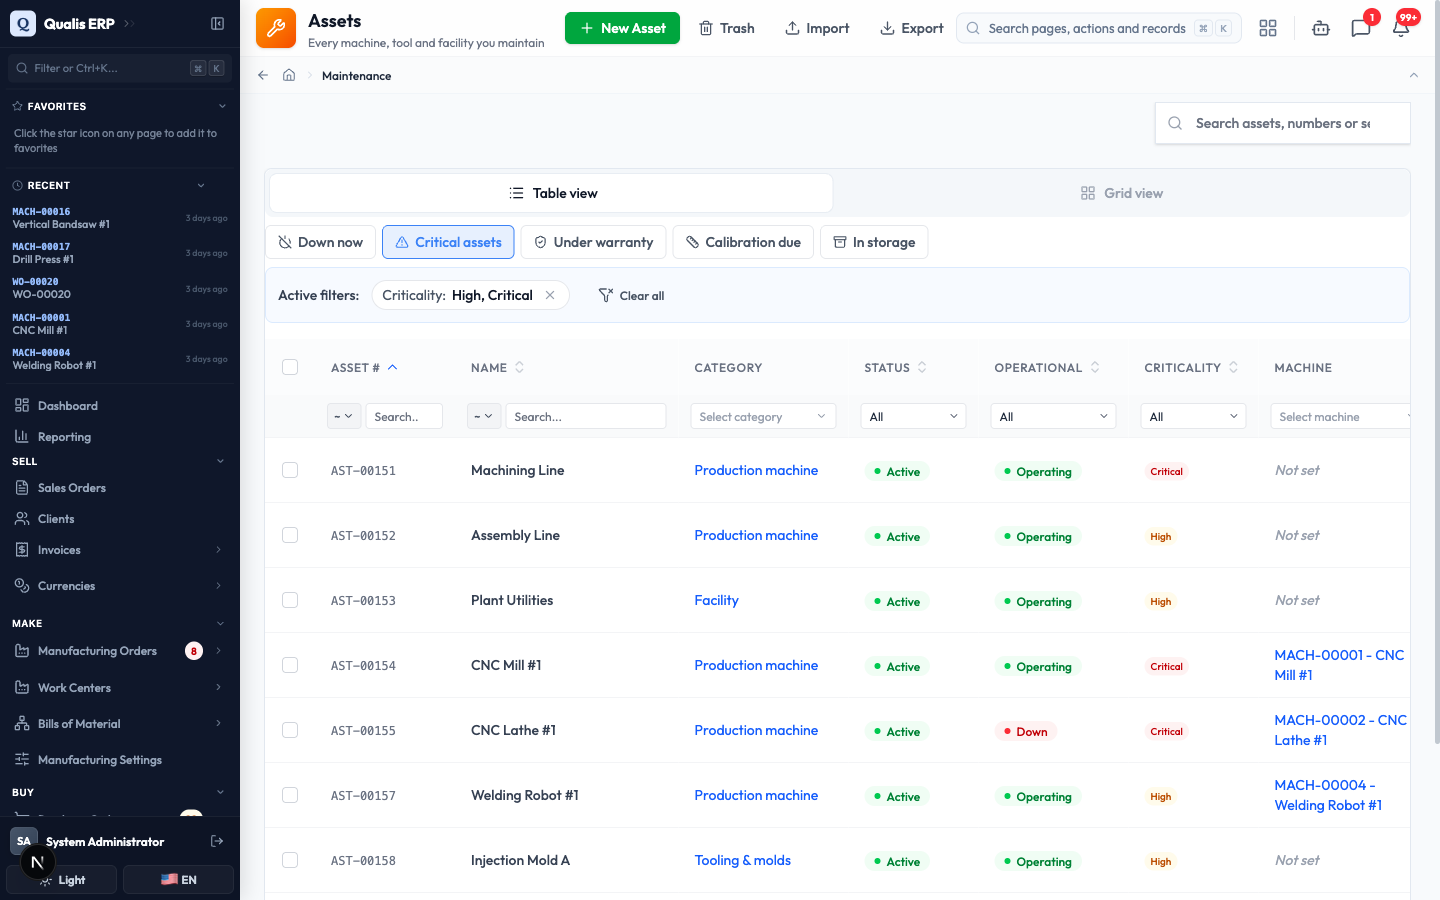
Whenever a filter is on, an Active filters banner appears. Click the small x on a chip to drop one filter, or Clear all to reset. The web address updates too, so you can bookmark a filtered view or send it to a colleague.
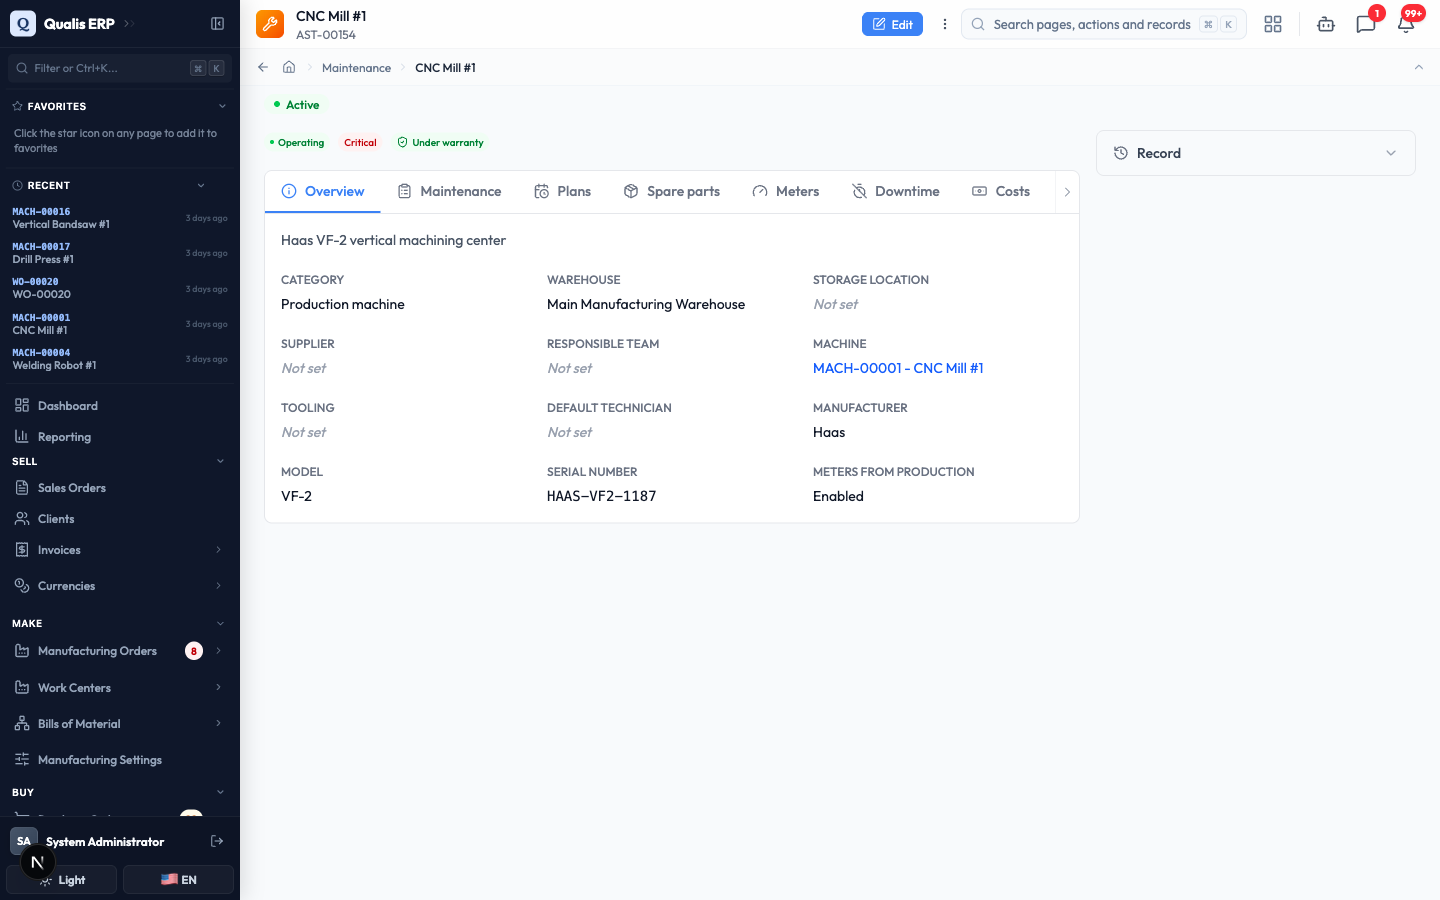
- Click an asset to open it. The Overview tab holds the facts (category, warehouse, manufacturer, model, serial number), and the tabs across the top take you to its history: Maintenance for past and open jobs, Plans for its routine schedules, Spare parts, Meters, Downtime and Costs.
Report a problem
Anyone who works with a machine can report a problem, and it takes about twenty seconds. You do not need to know who will fix it or how urgent it really is.
- In the sidebar under Maintenance, open Requests, then click Report a problem.
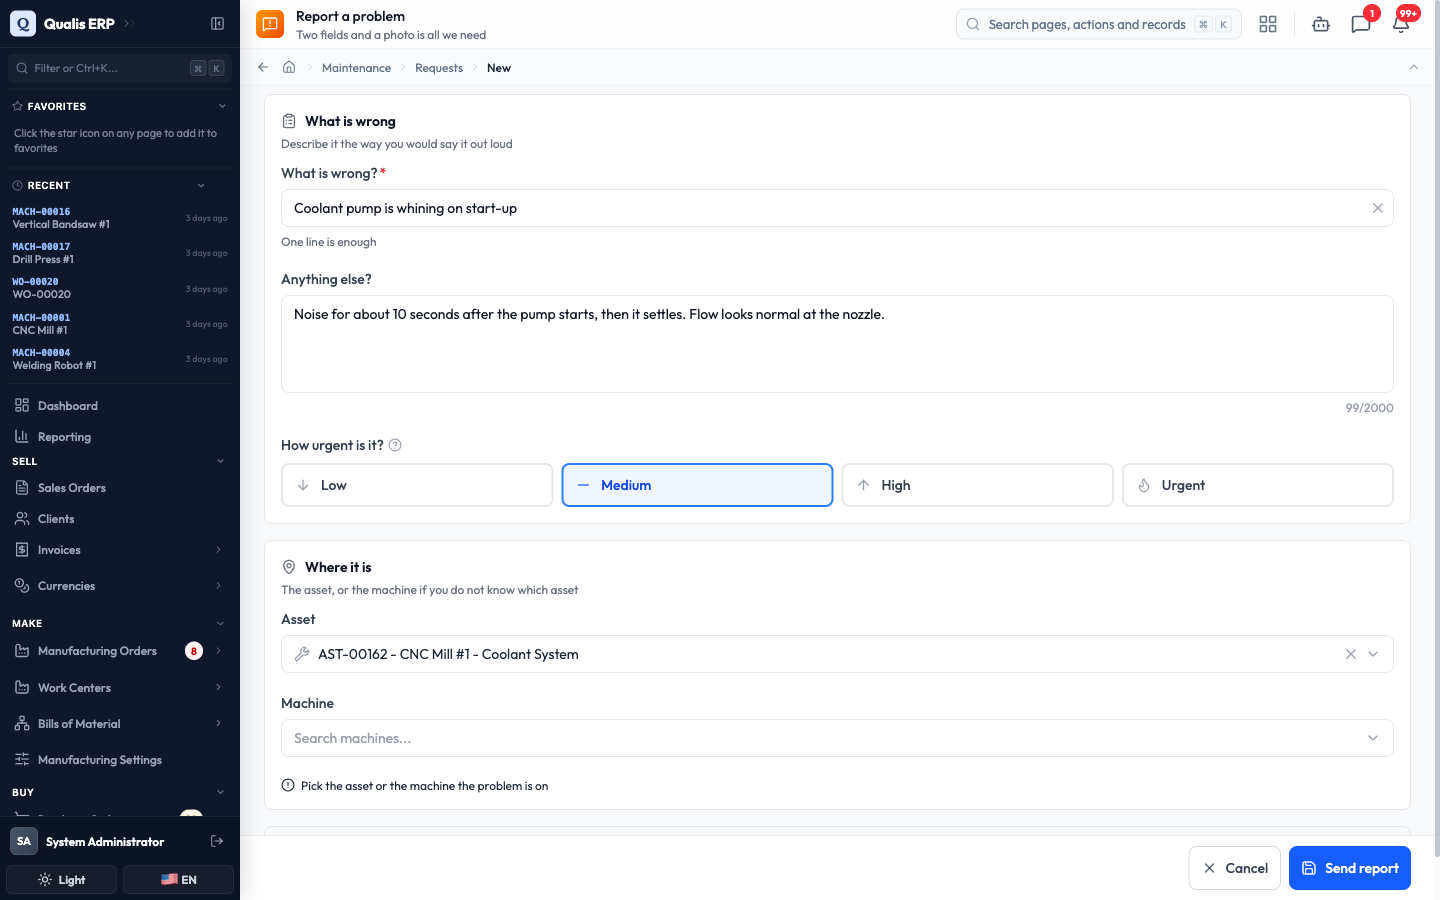
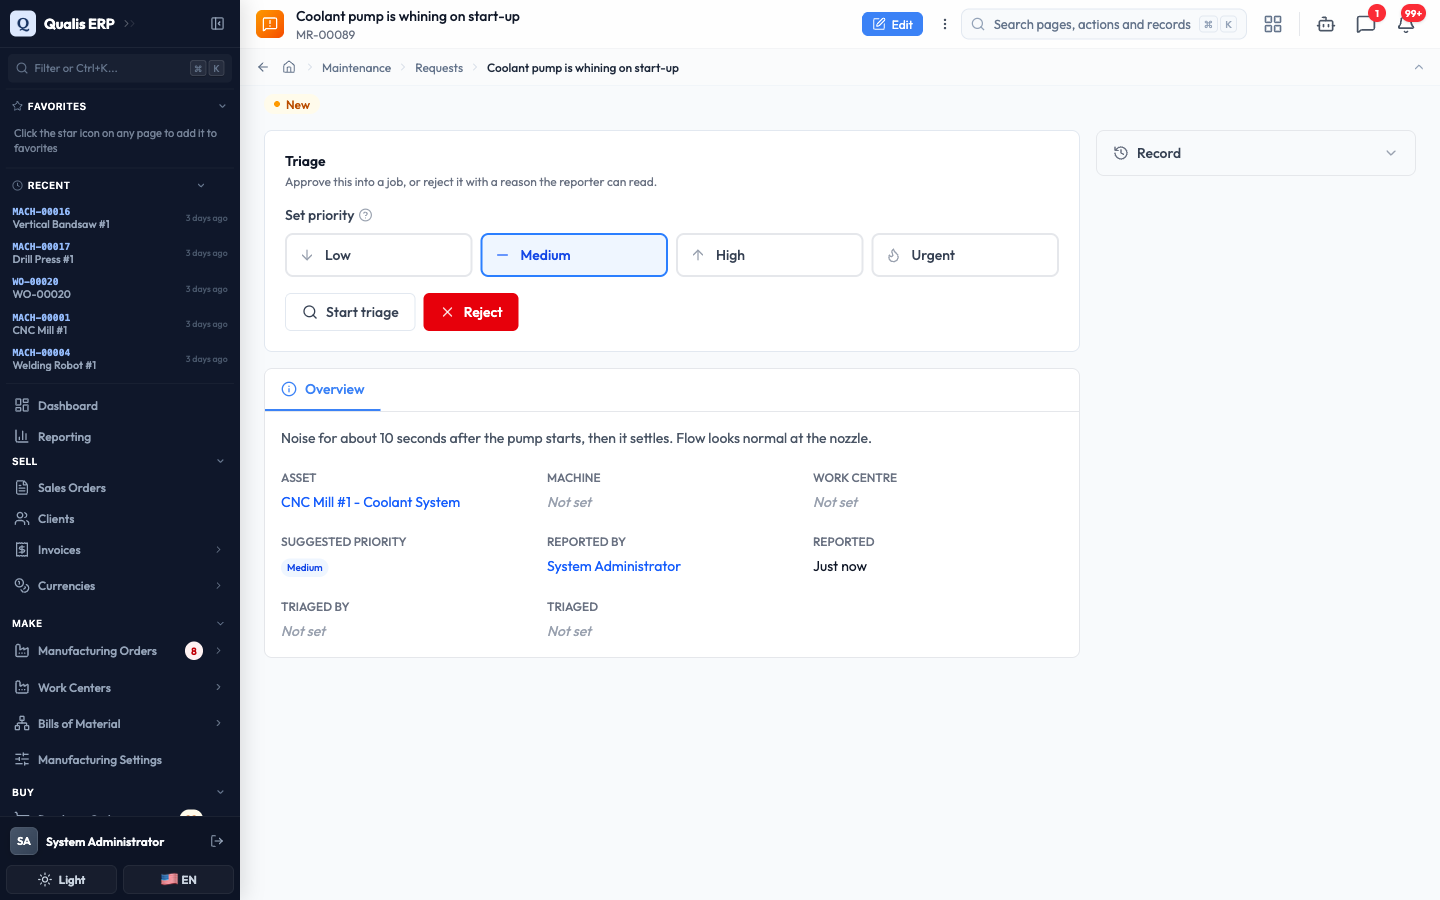
- In What is wrong?, write one line in your own words, for example "Coolant pump is whining on start-up". This is the only field you must fill in.
- Use Anything else? to add what you noticed: when it started, what it sounds like, what you already tried.
- Pick How urgent is it?: Low, Medium, High or Urgent. Maintenance may change this when they look at your report, and that is fine.
- Under Where it is, pick the Asset, or the Machine if you are not sure which asset it belongs to. Adding Photos is optional and always helps.
- Click Send report.
Your report gets a number (like MR-00089) and lands in the maintenance queue as New. You are told automatically when the work is finished, so there is no need to chase anyone.
Turn a report into a job
This is the maintenance planner's daily routine: look at what came in, decide what is worth doing, and turn it into real work.
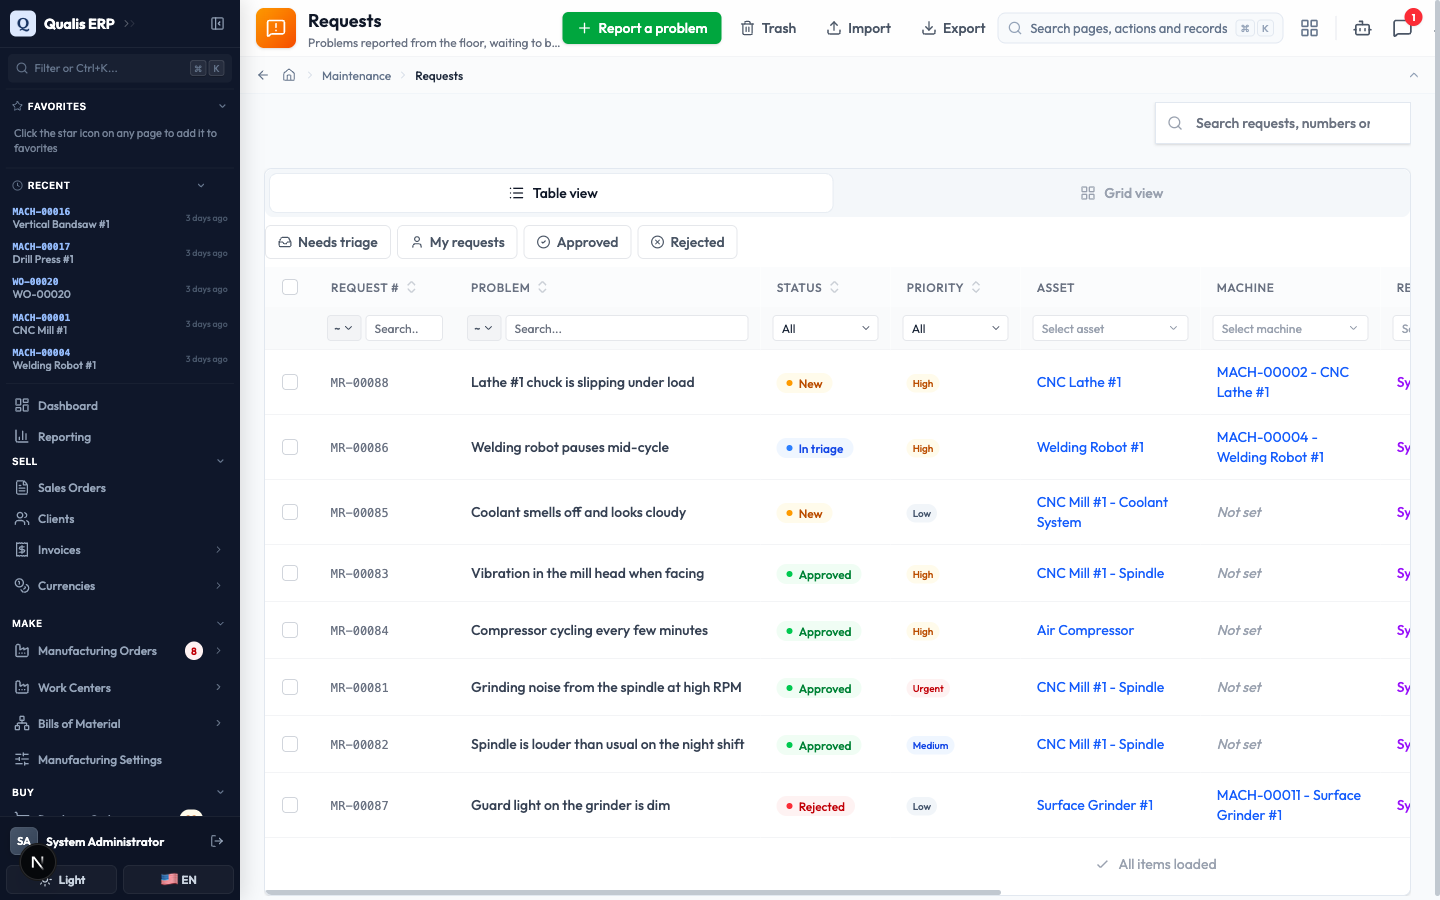
- Open Requests. The Needs triage quick filter shows everything waiting on you. The other filters are My requests, Approved and Rejected.
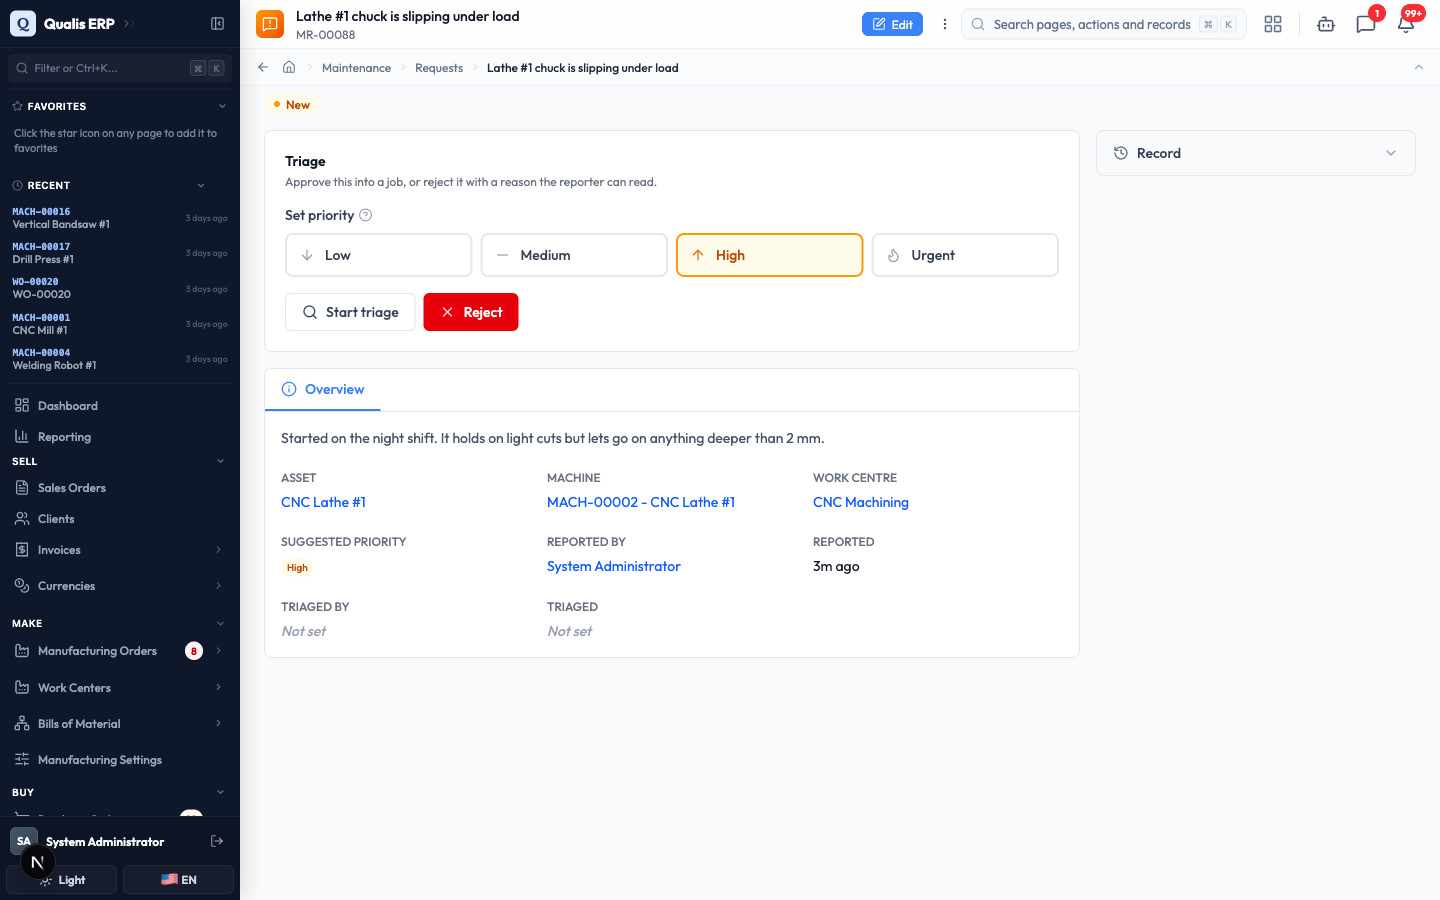
- Open a report. The Triage panel sits at the top. Adjust Set priority if the reporter's guess was off, then click Start triage to show you are looking at it.
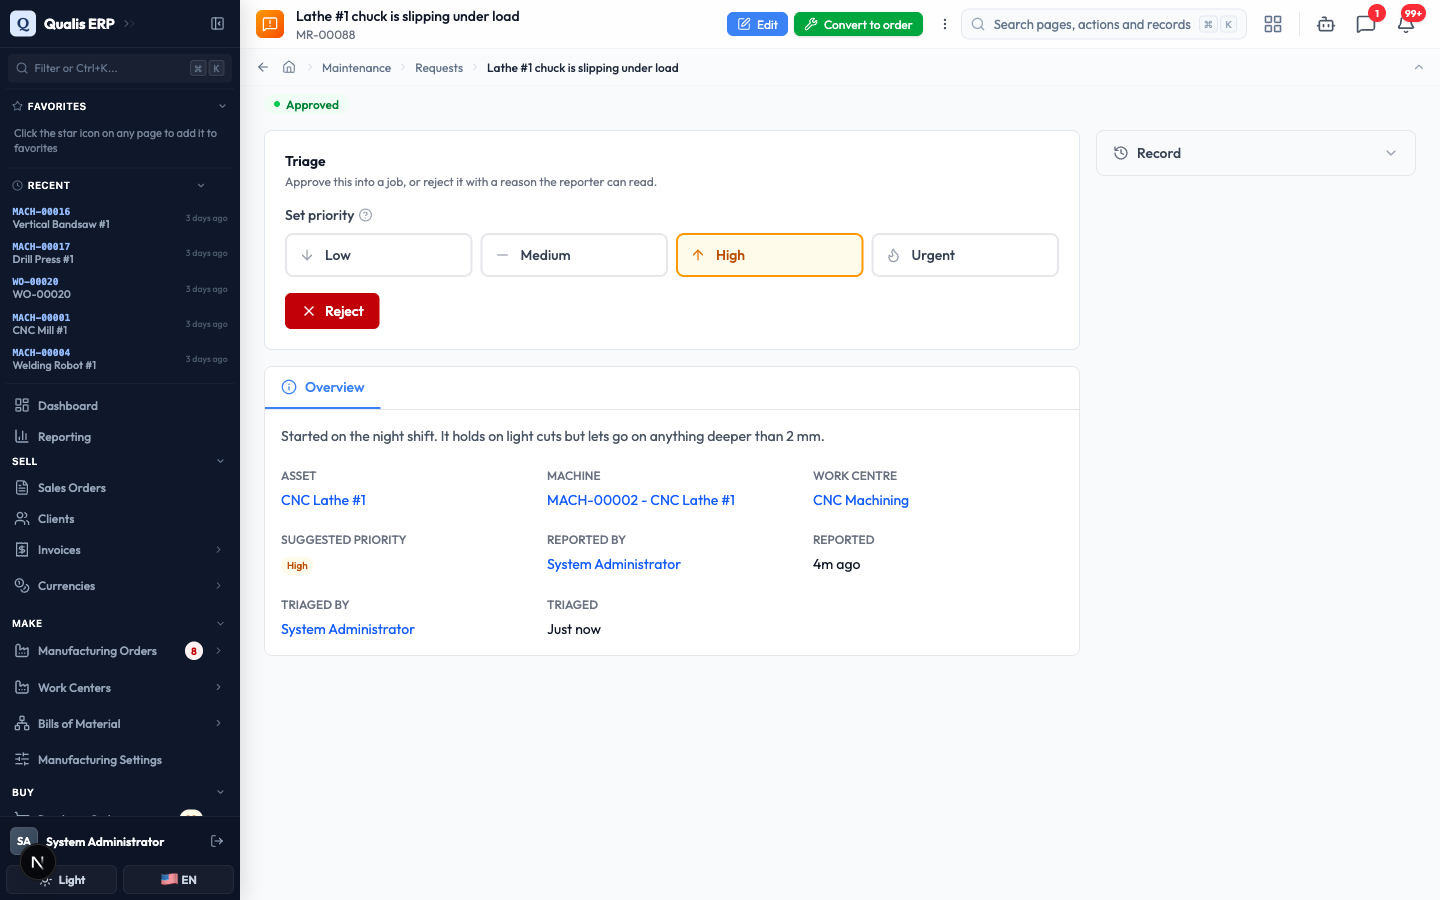
- Click Approve when the work should go ahead. A Convert to order button appears at the top of the page.
- Click Convert to order. Check the asset the job will be raised against, then click Create the order.
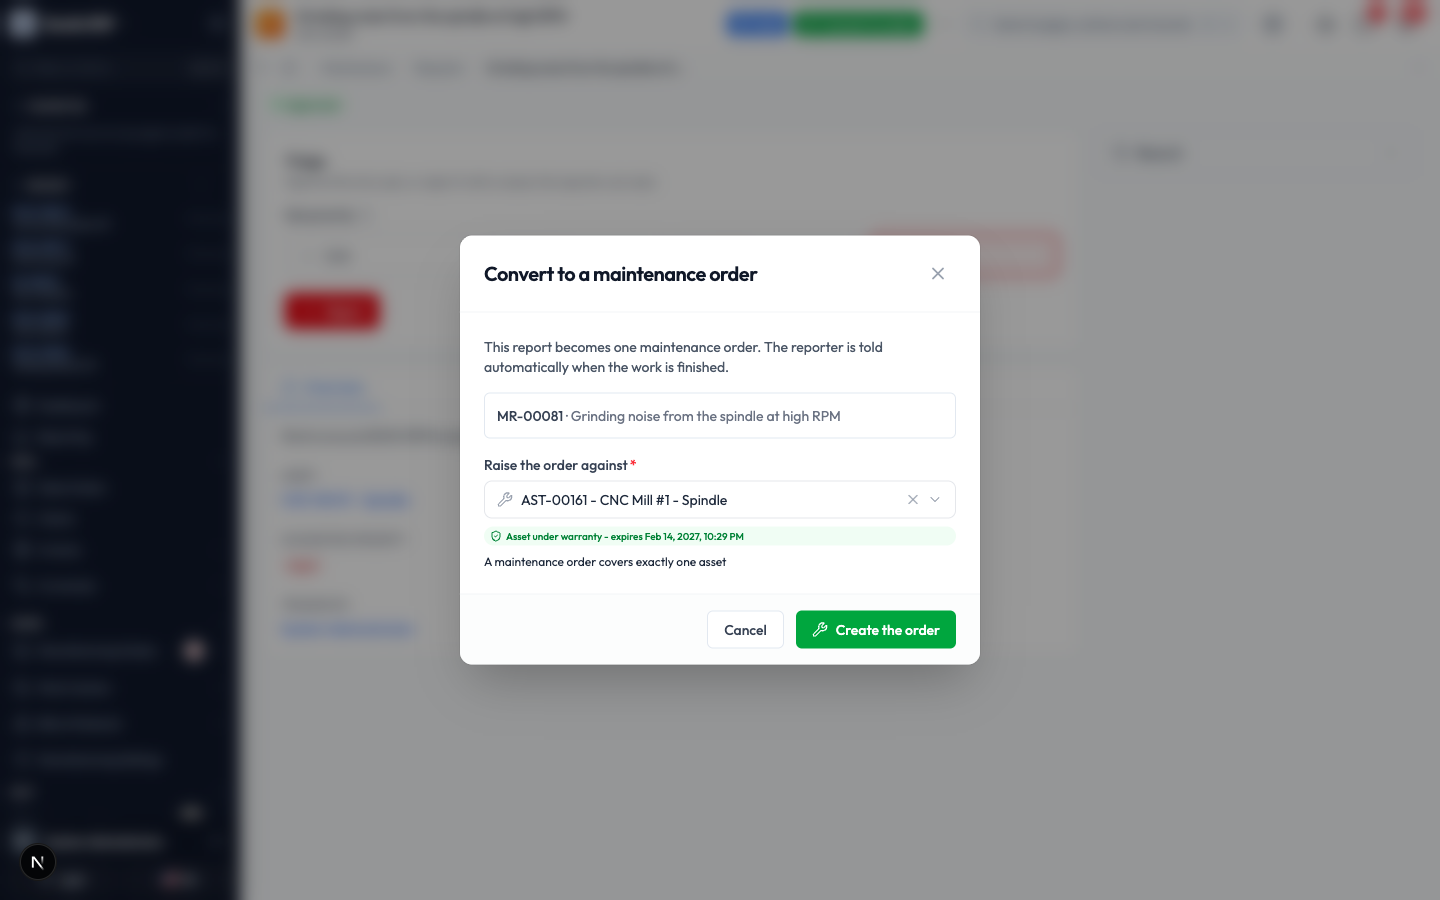
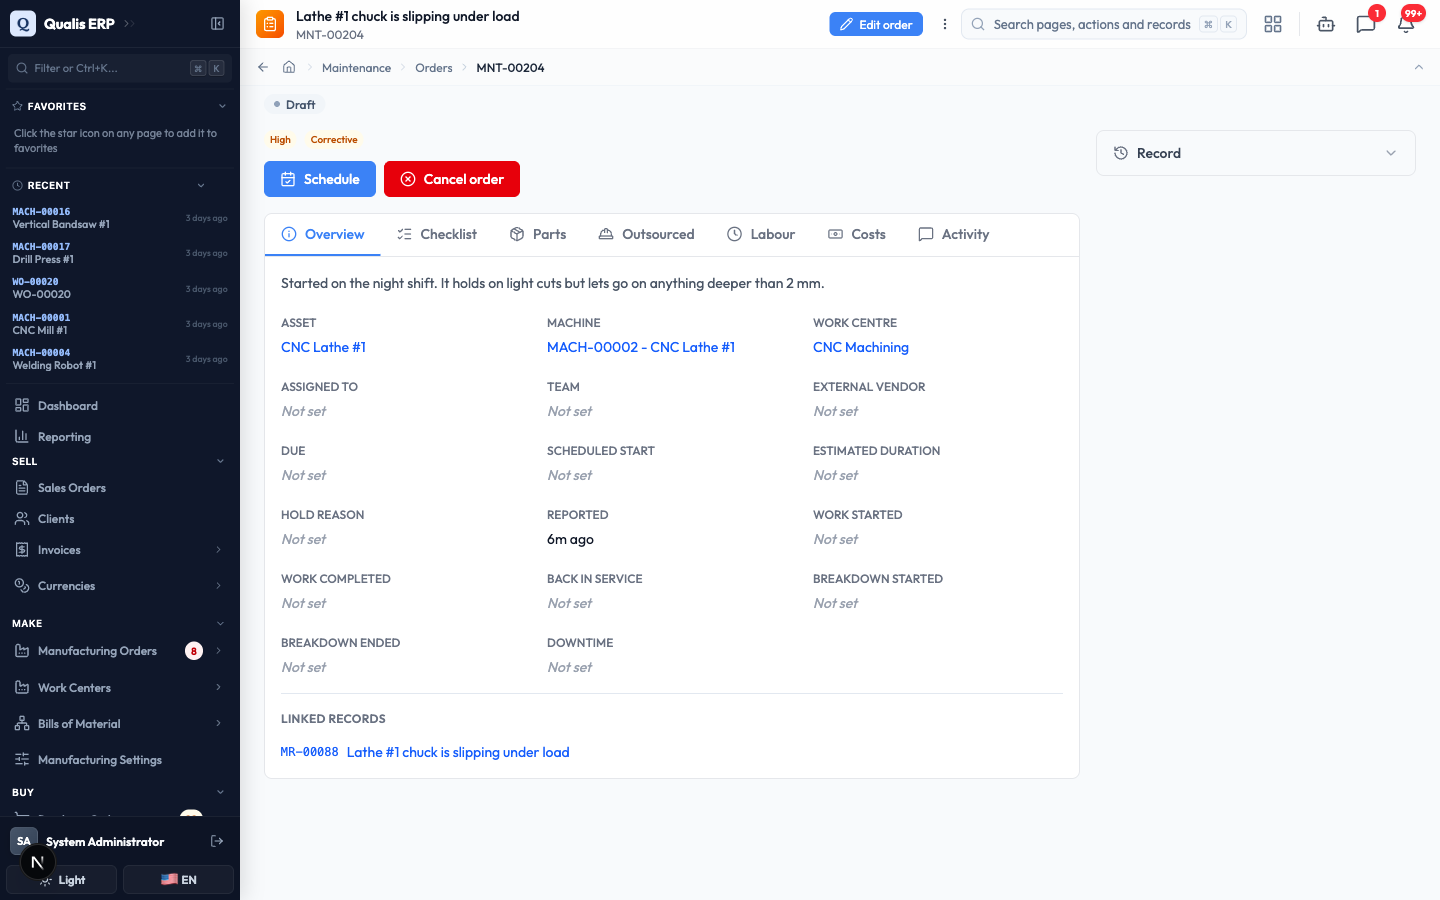
Qualis creates the maintenance order, numbers it (like MNT-00204), and opens it. The report it came from is shown under Linked records, and the reporter will be told when the job is done.
If a report is not worth doing, click Reject instead and give a reason. The reason is written for the reporter to read, so explain it the way you would in person.
Do the work
This is the technician's side of the module: pick up a job, work through it, and record what happened.
- In the sidebar under Maintenance, open My work. Every job assigned to you is a card showing its number, status, the asset, the priority and when it is due. Anything late is called out in red.
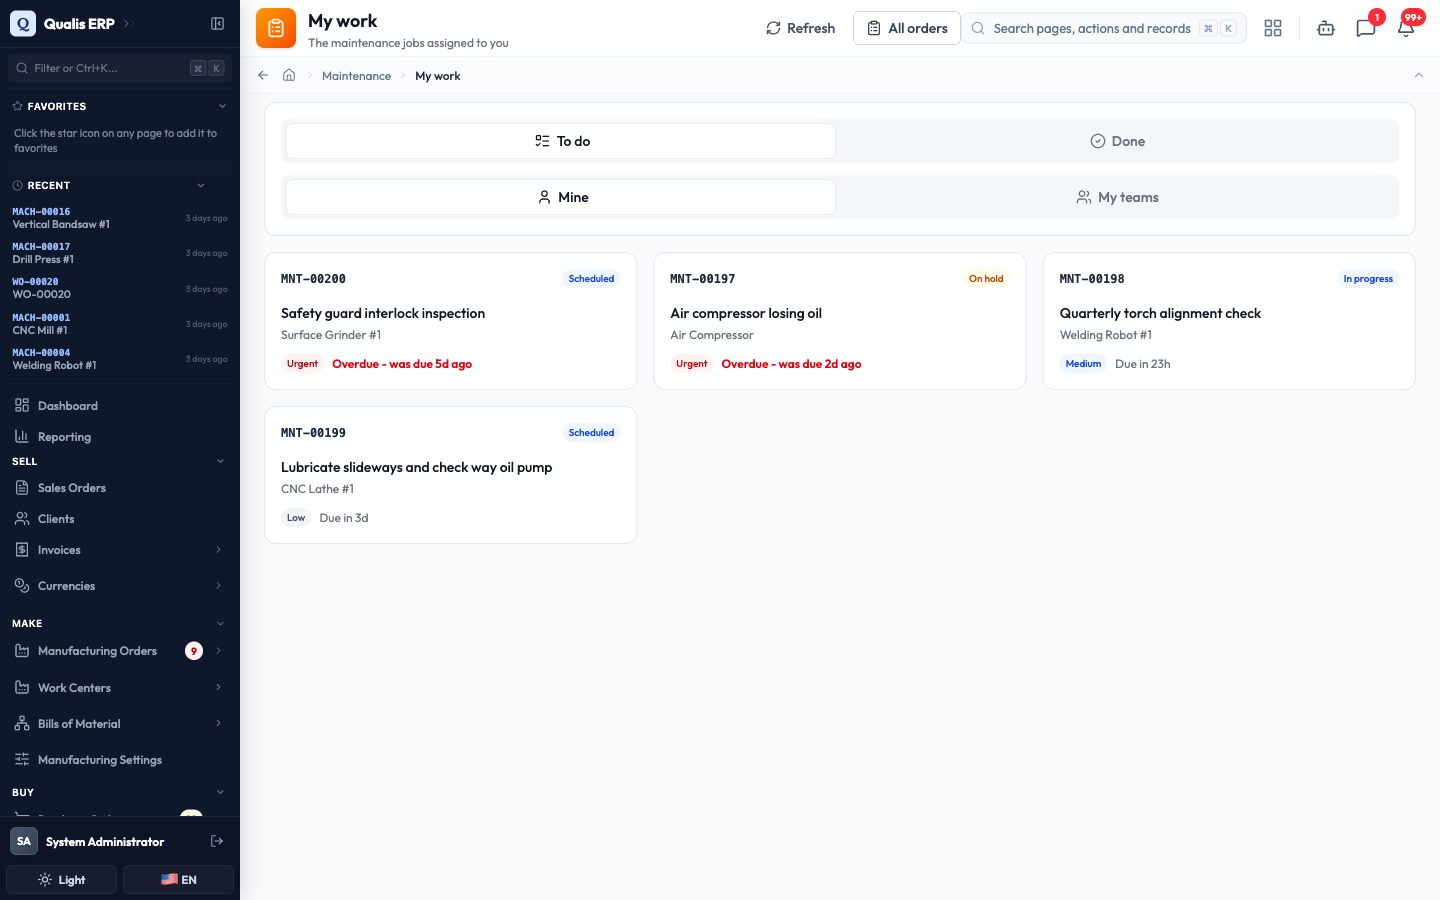
The To do and Done buttons switch between work you still have and work you finished. Mine and My teams widen the queue to jobs your team shares.
- Click a job to open it, then click Start work. This is what starts the clock the "how long did it take" figures are measured from.
- Open the Checklist tab. If a procedure was attached to the job, the steps appear here. Each step asks for exactly one thing: a tick, a Pass or Fail, a reading, a photo or a signature. Steps marked Required must be answered before you can finish.
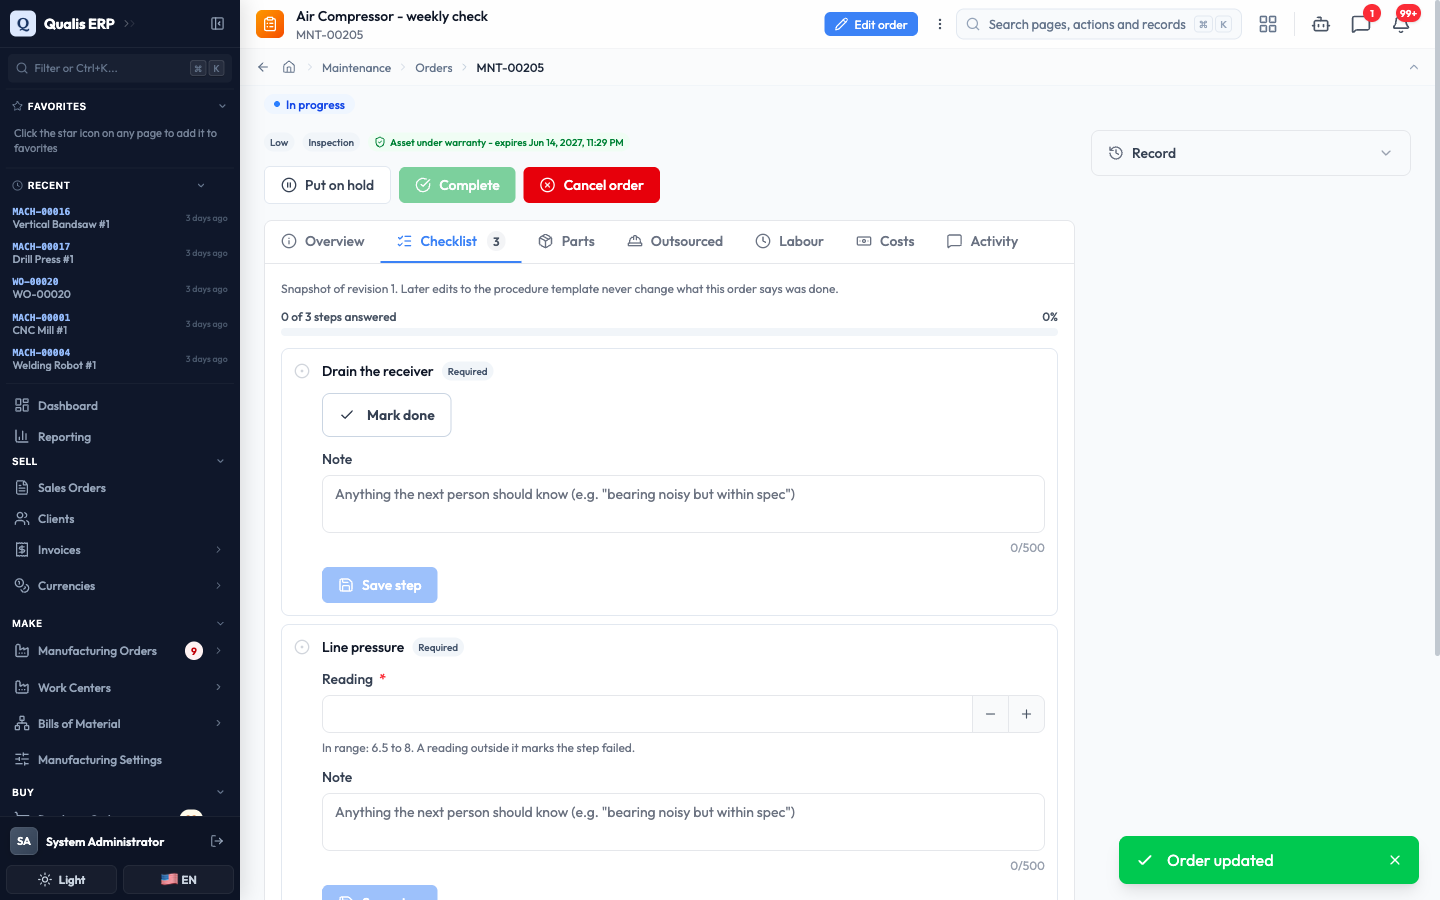
- Answer a step, add a Note if the next person should know something, then click Save step. The progress bar at the top counts up as you go.
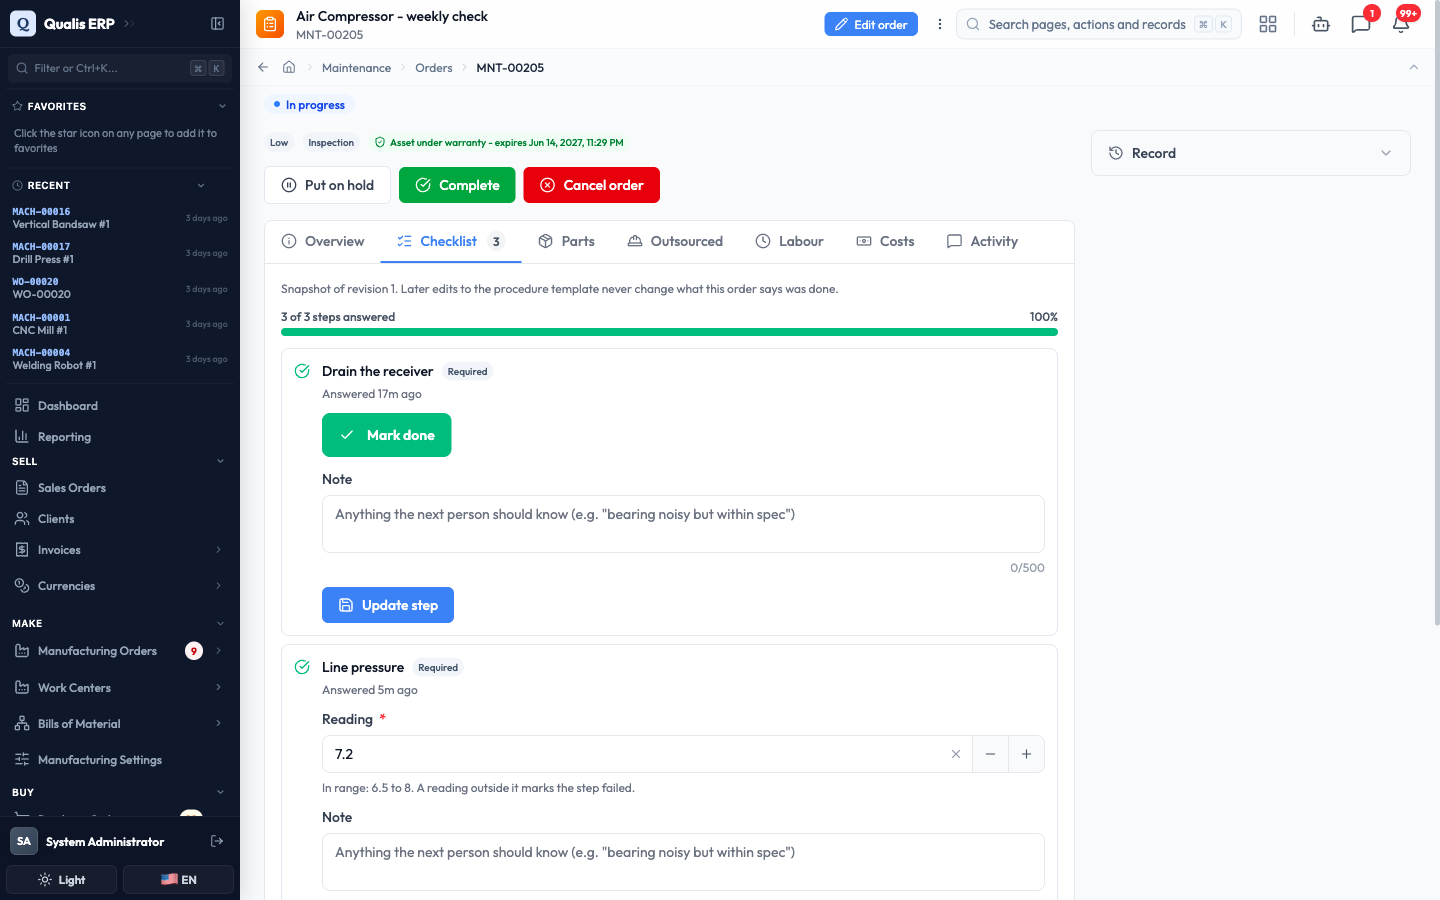
- When the work is done, click Complete. Record what happened: turn on The asset stopped producing if production was interrupted (you will then be asked when it stopped and when it ran again), check Back in service, and write What was done.
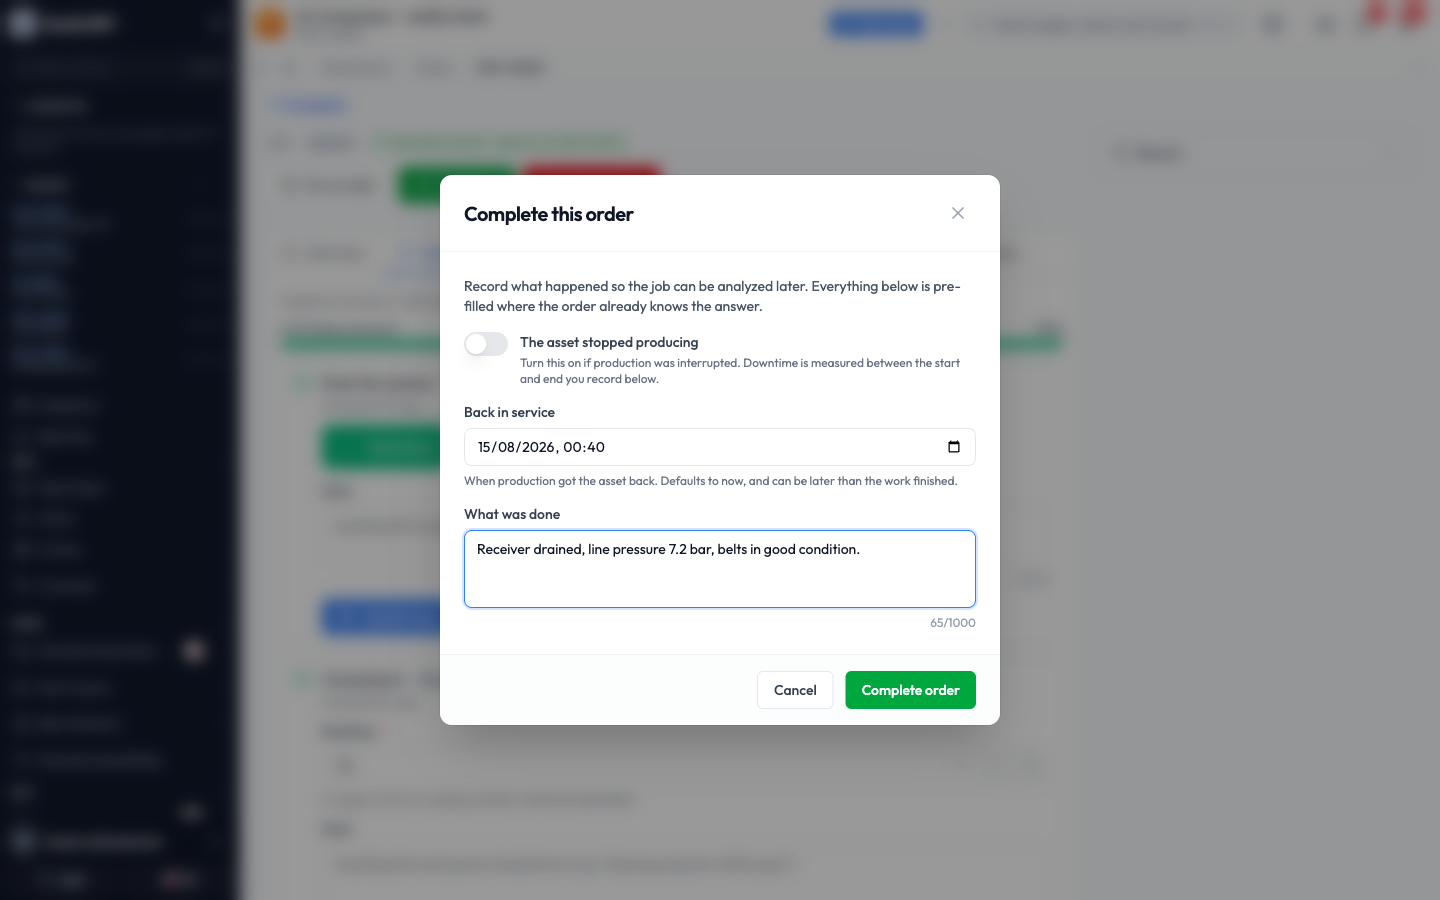
- Click Complete order.
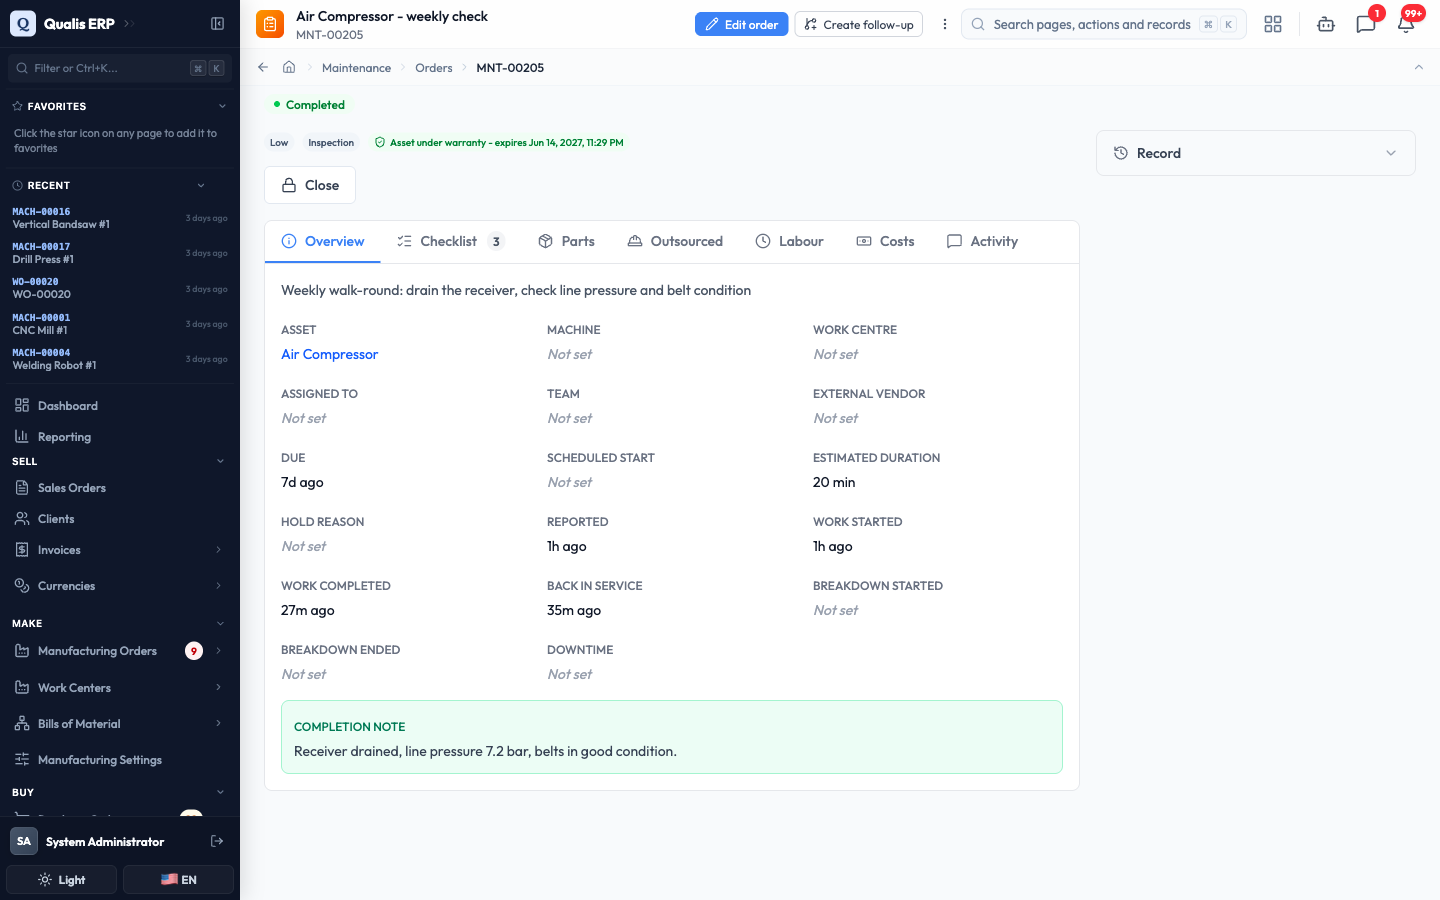
The job moves to Completed, your checklist becomes the permanent record of what was done, and the note appears on the job. If the report that started it came from the floor, the person who reported it is told automatically.
A corrective job also asks you to classify the failure with a Problem, Cause and Remedy code before it can be completed. Those three codes are what later tells you why your machines actually stop.
Plan work before something breaks
A PM plan (preventive maintenance plan) is a standing instruction: every so often, raise this job on this machine. It is the difference between fixing machines and looking after them.
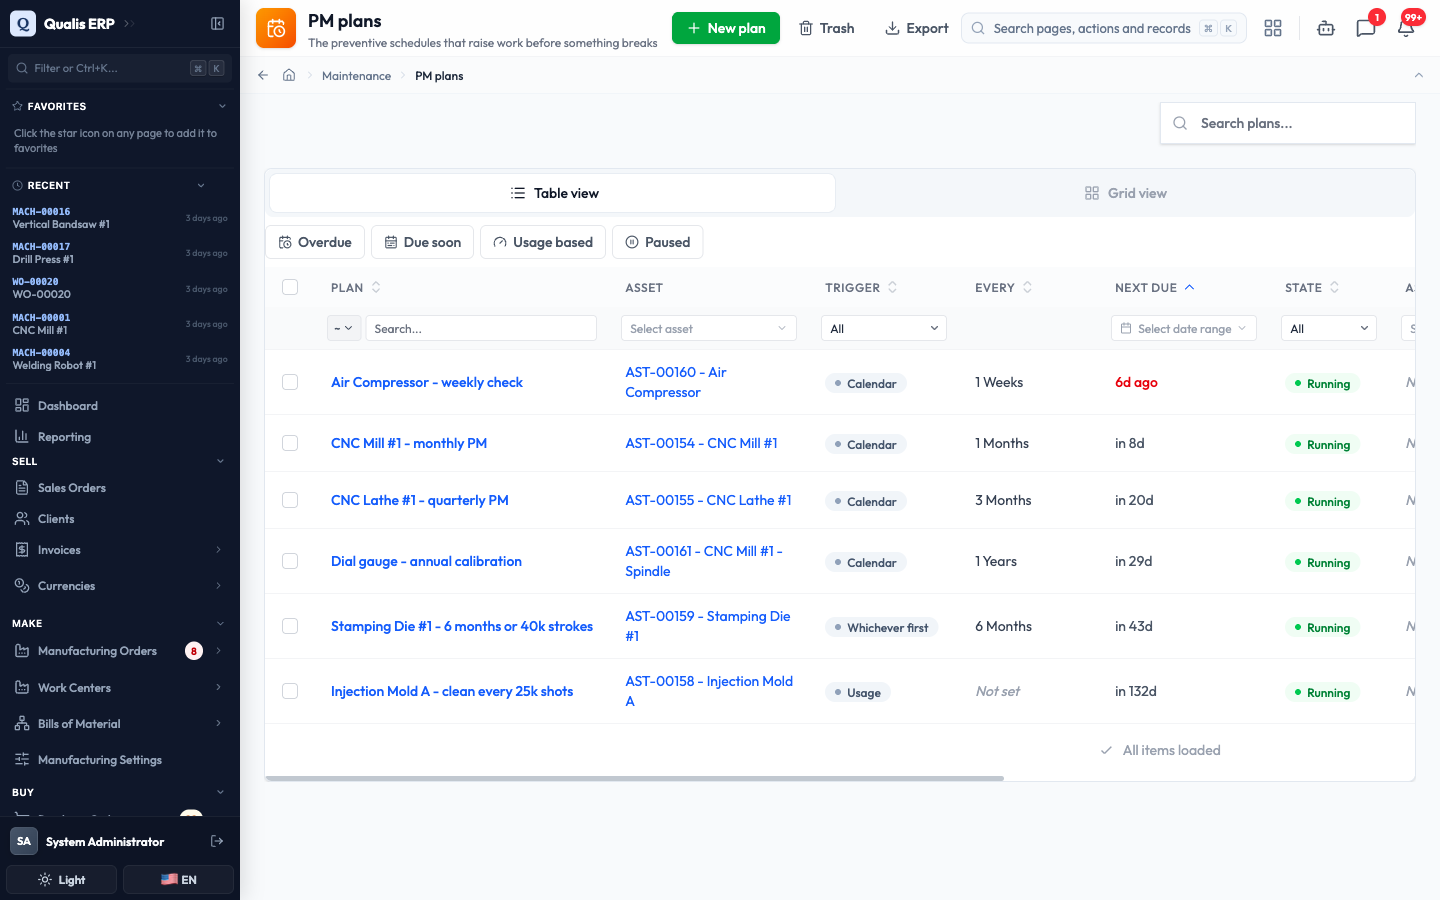
- In the sidebar under Maintenance, open PM plans. Each plan shows the asset, what triggers it, how often, when it is Next due and whether it is running.
-
Click New plan to add one, or open an existing plan to review it. A plan can be triggered three ways:
- by the calendar, for example every 1 month
- by usage, for example every 25,000 shots on a meter
- by whichever comes first, for machines where both matter
-
On the plan you can see everything it will do: the asset, the interval, the Procedure whose checklist each job will carry, the estimated minutes and when the next one falls due.
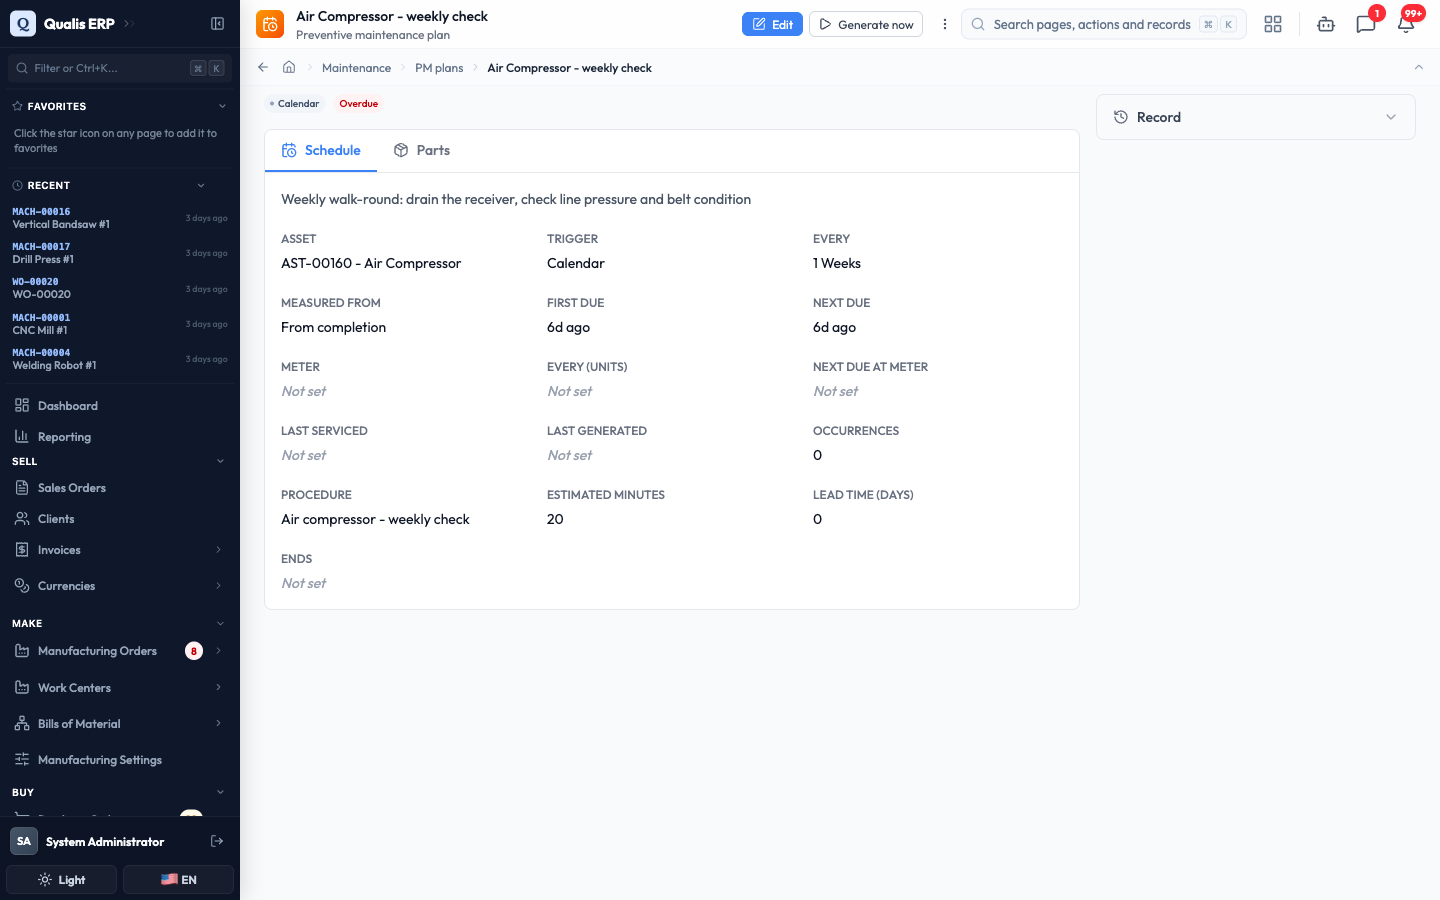
- Qualis raises the jobs for you when they come due. To raise one immediately, click Generate now.
The job is created, scheduled and already carries the procedure's checklist, ready for whoever picks it up.
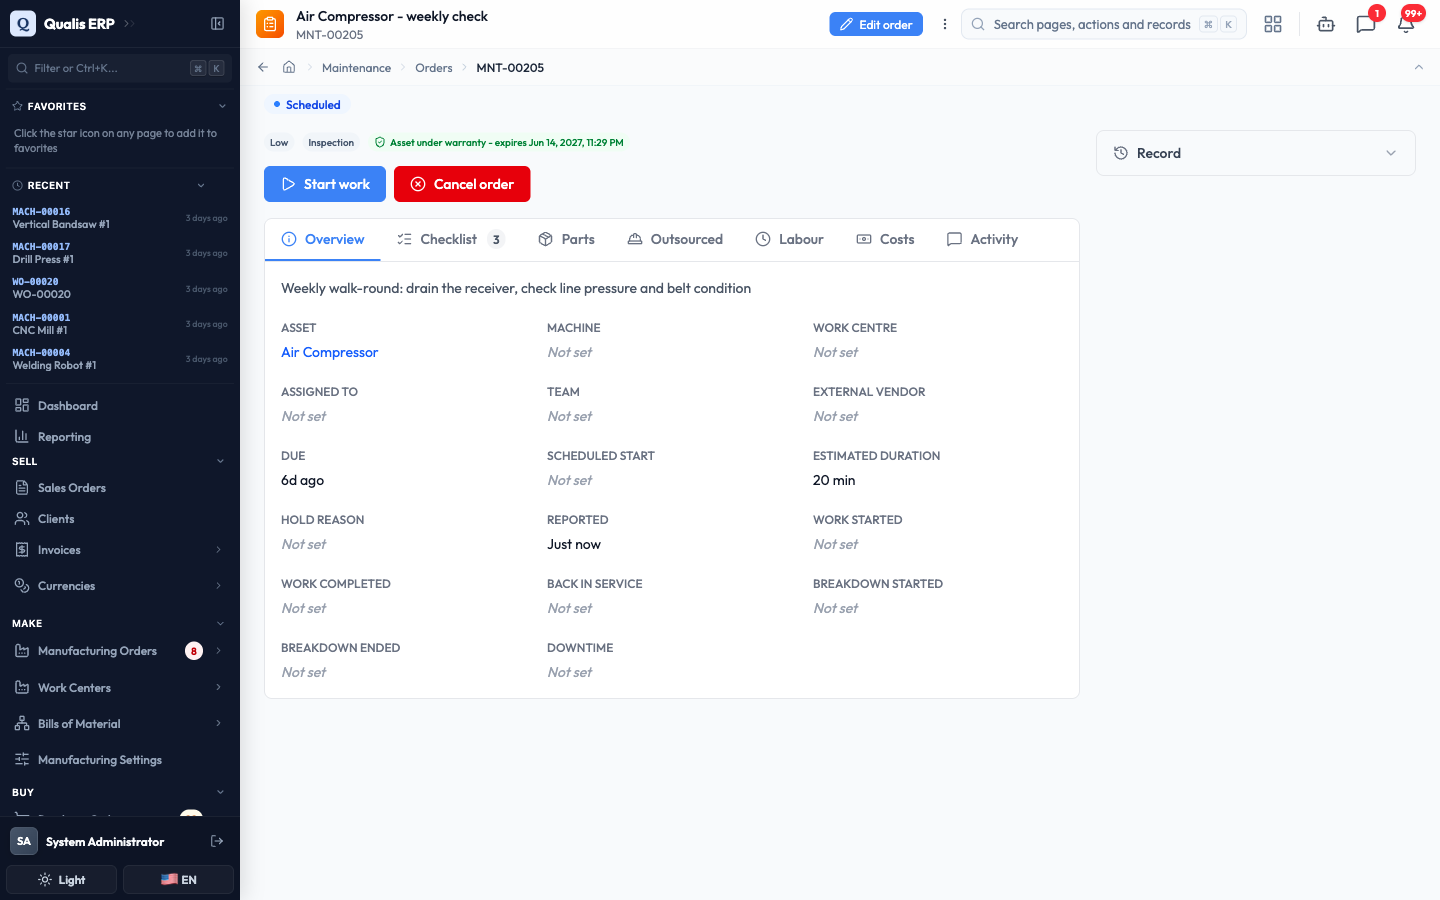
Measured from decides how the next date is worked out. "From completion" moves the schedule when a service runs late, which suits things like lubrication. Keeping the calendar suits jobs that must happen on a fixed day whatever else happened.
Let production update your meters
A meter is a counter on a machine: running hours, cycles, shots, kilometres. Meters are what usage-based plans count, and Qualis can keep them up to date from your production records so nobody has to write numbers on a clipboard.
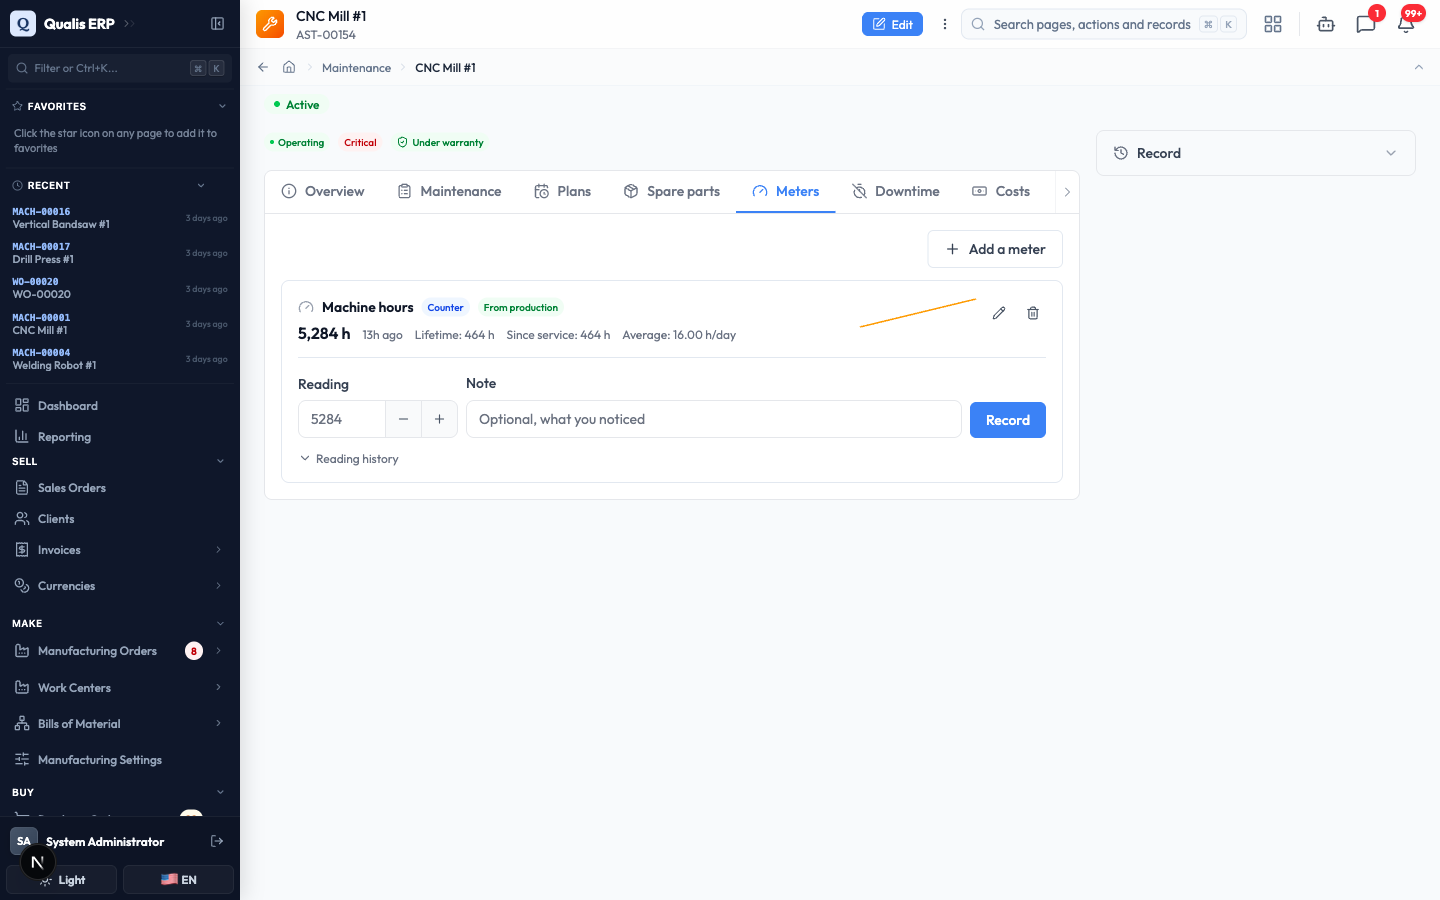
- Open an asset and go to its Meters tab. Each meter shows its latest reading, how long ago it came in, the lifetime total, the amount since the last service and the average use per day.
- A meter marked From production is updated automatically as manufacturing work is completed on that machine. One marked Counter or Gauge is read by a person.
- To record a reading yourself, type it into Reading, add an optional note, and click Record. Open Reading history to see everything recorded so far.
A counter only ever goes up, so Qualis refuses a reading that would contradict a later one already on record, and tells you which reading it clashes with. That is what keeps usage-based schedules honest. If a counter physically wraps around (a five digit display, for example), set its Rollover point when you create the meter so the wrap can be read correctly.
See how maintenance is performing
Once a few jobs have been through the system, the analytics page answers the questions a manager asks.
- In the sidebar under Maintenance, open Analytics, then choose a period with From and To.
- The tiles across the top cover reliability and workload. The ones worth knowing:
- MTTR (active repair): your crew's average wrench time on a failure, waiting excluded.
- Mean down time: what production actually felt, including waiting for a technician, a part, or the handover back. It is always the larger number.
- MTBF: operating hours divided by the number of failures. The longer, the better.
- Availability: the share of the time the equipment was there when production wanted it.
- PM compliance: how much of your planned preventive work actually got done on time.
- Below the tiles, Downtime bad actors and Failures by problem code rank where your losses come from, Open work shows where the queue is sitting right now, and Waiting on parts lists the jobs stuck on a delivery, oldest first.
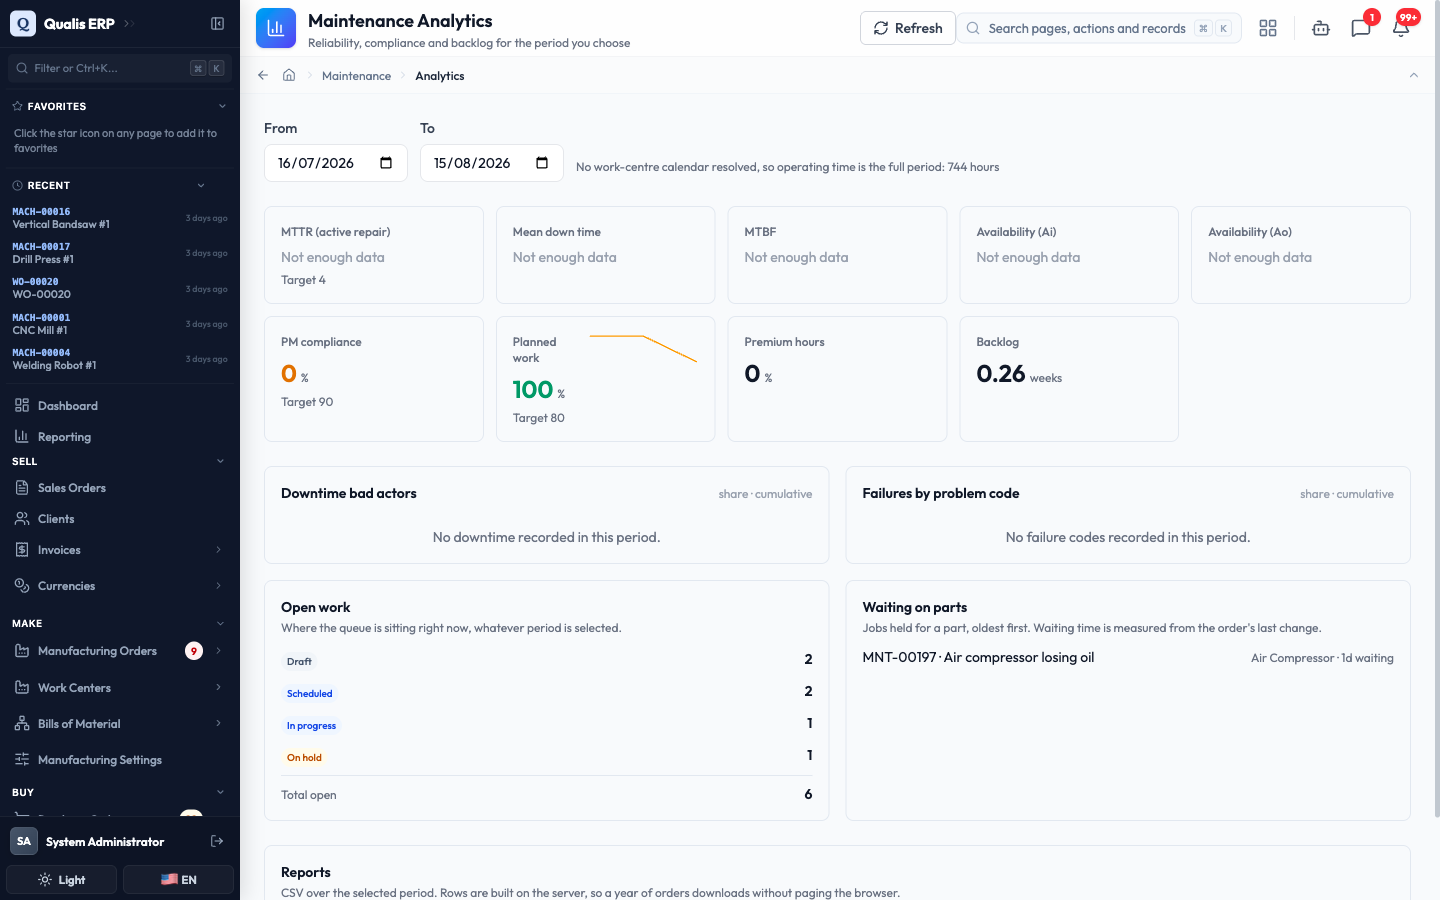
Every tile explains its own formula when you hover it, and tiles say Not enough data rather than guessing when the period has too little history.
Good to know
A few words come up throughout the module:
- Asset: anything you maintain, from a whole production line down to a spindle or a gauge. Assets can sit inside each other.
- Request: a problem reported from the floor. It is not work yet, it is a report waiting to be looked at.
- Maintenance order: the job itself. It carries the checklist, the time booked, the parts used and the cost.
- Procedure: a reusable checklist. When it is attached to a job, the job keeps a frozen copy, so improving the template later never rewrites what an old job says was done.
- PM plan: a schedule that raises jobs automatically, by date, by meter, or by whichever comes first.
- Meter: a counter on an asset (hours, cycles, shots) that usage-based plans count against.
- Breakdown: a stoppage that interrupted production. Marking one is what feeds the downtime and availability figures, so only tick it when production really stopped.